Wow.
What fun!
After successfully getting my USB SDR to work on rtl_power I have some information to share. To my surprise, it took very little time.
Here’s the first example I’ve created using the rtl_power software combined with the Python heatmap.py script.
First, I entered the Terminal command I to fire up the USB SDR:
rtl_power -f 150M:160M:8k -g 25 -i 10 -e 1h -c 30% police1h.csv
This command initiated a 10-second scan with a gain value of 25 across 10 MHz (150-160 MHz), logged the scan results, then repeated this process for 1 hour. It then terminated itself. Once terminated, the command also ditched 30% of the data from the outside edges of the scan before dumping a csv file named, “police1h.csv,” into the root folder of the heatmap.py script. Yarp.
The last piece of the pie was to run the heatmap.py script on the police1h.csv file. Here’s that command:
python heatmap.py police1h.csv police1h.jpg
Other image types should be possible based on the Python Image Libraries installed earlier. This command will ran the heatmap.py script on the data and dumped the image file in the root of the heatmap script folder.
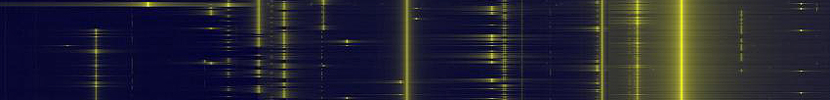
Here’s an image based on the results. This area of the RF spectrum in my location is busy with San Jose dispatch, fire, and police. I’ve trimmed this image because not much was going on above 157 MHz.
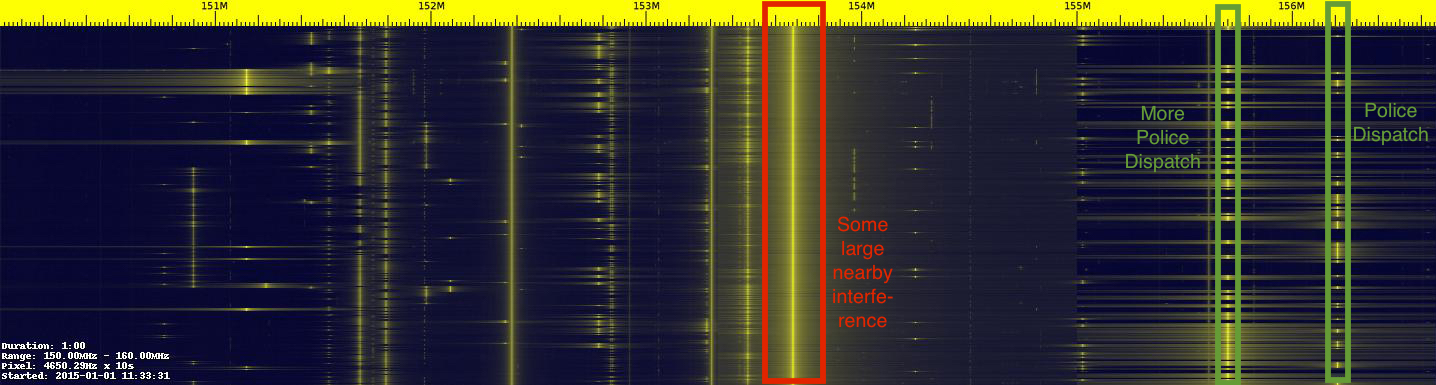
The dark areas represent the periods of the scan where the received data did not cross the gain threshold set in the initial command. The bright yellow areas represent the periods of the scan where the received data surpassed the gain threshold; by how much is illustrated by the amount of brightness. The brighter the yellow, the stronger the received signal. “Stronger signals” can be interpreted as the result of power applied to the transmission in relation to surrounding noise and proximity to the receiving antenna.
Scan all the things

Leave a comment